
One screen. What the building is doing.
An energy dashboard exists to make consumption visible to people who will never open a historian. If it takes more than a glance to see whether something is wrong, it has not done its job.
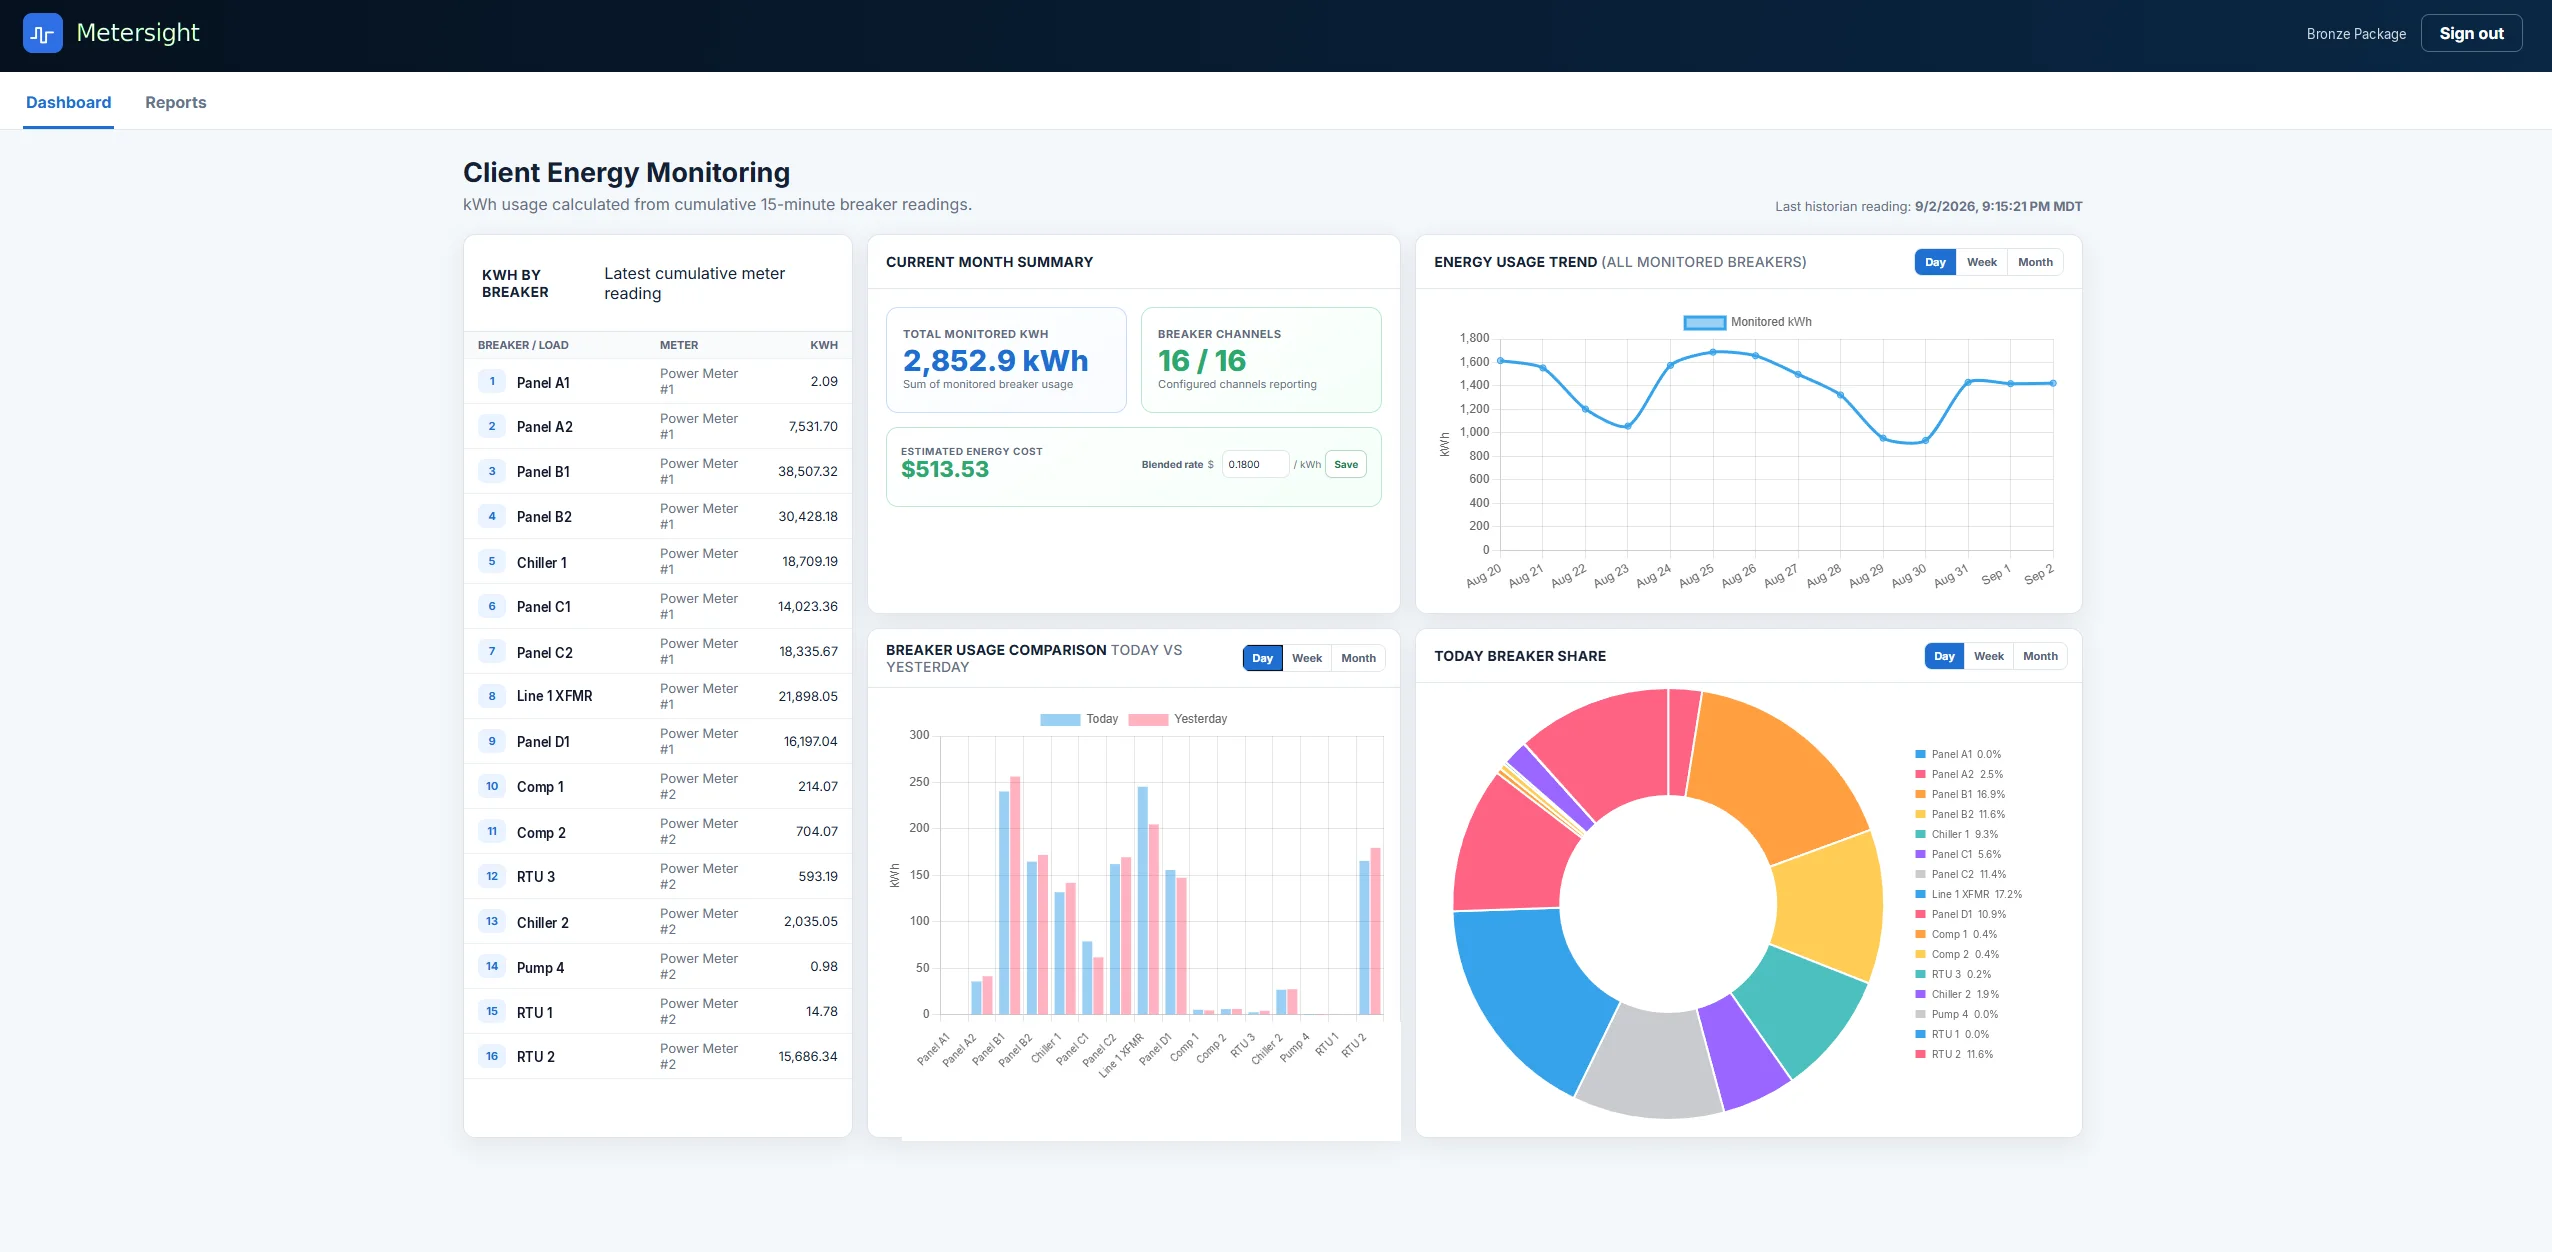
Different people need different screens.
Building one dashboard for everybody produces a screen that serves nobody particularly well.
Facility overview
Total demand, energy today, cost to date and the largest loads. The screen that goes on the wall.
Area drill down
One building, one line or one tenant, with its own trends and its own share of the total.
Demand watch
Rolling demand against the current billing peak, so an approaching threshold is visible before it is set.
Comparison
This week against last week, this site against another, this shift against the one before it.
Cost view
The same data expressed in dollars using your actual tariff, including time of use periods where they apply.
Meter health
Which meters are responding, which have gone quiet, and when each last reported.
Answers before you call.
A live screen showing electricity consumption and demand across a facility, broken down by area, meter or load, with historical trends behind it. The point is to make consumption visible to people who are not going to dig through interval data themselves.
Yes. The dashboards we build are web based and responsive, so the same system works on a wall display in the maintenance office, a laptop and a phone.
Facility and maintenance managers watching for anomalies, plant managers tracking consumption against production, and finance looking at cost. Each usually wants a different screen, which is why we build more than one.
Yes. Gas, water, compressed air and steam are all commonly added, and comparing them on one timeline is often where a pattern becomes obvious.
Watch a dashboard update while we talk.
It is a better demonstration than any screenshot.
Or call (801) 946-2710, Monday, Friday, 8:00am, 4:30pm MT