
See what your electrical system is doing right now.
Power monitoring is the live view: kilowatts, volts, amps, hertz and power factor, updating as your plant runs. It is how you catch a demand spike while it is happening rather than reading about it on next month's invoice.
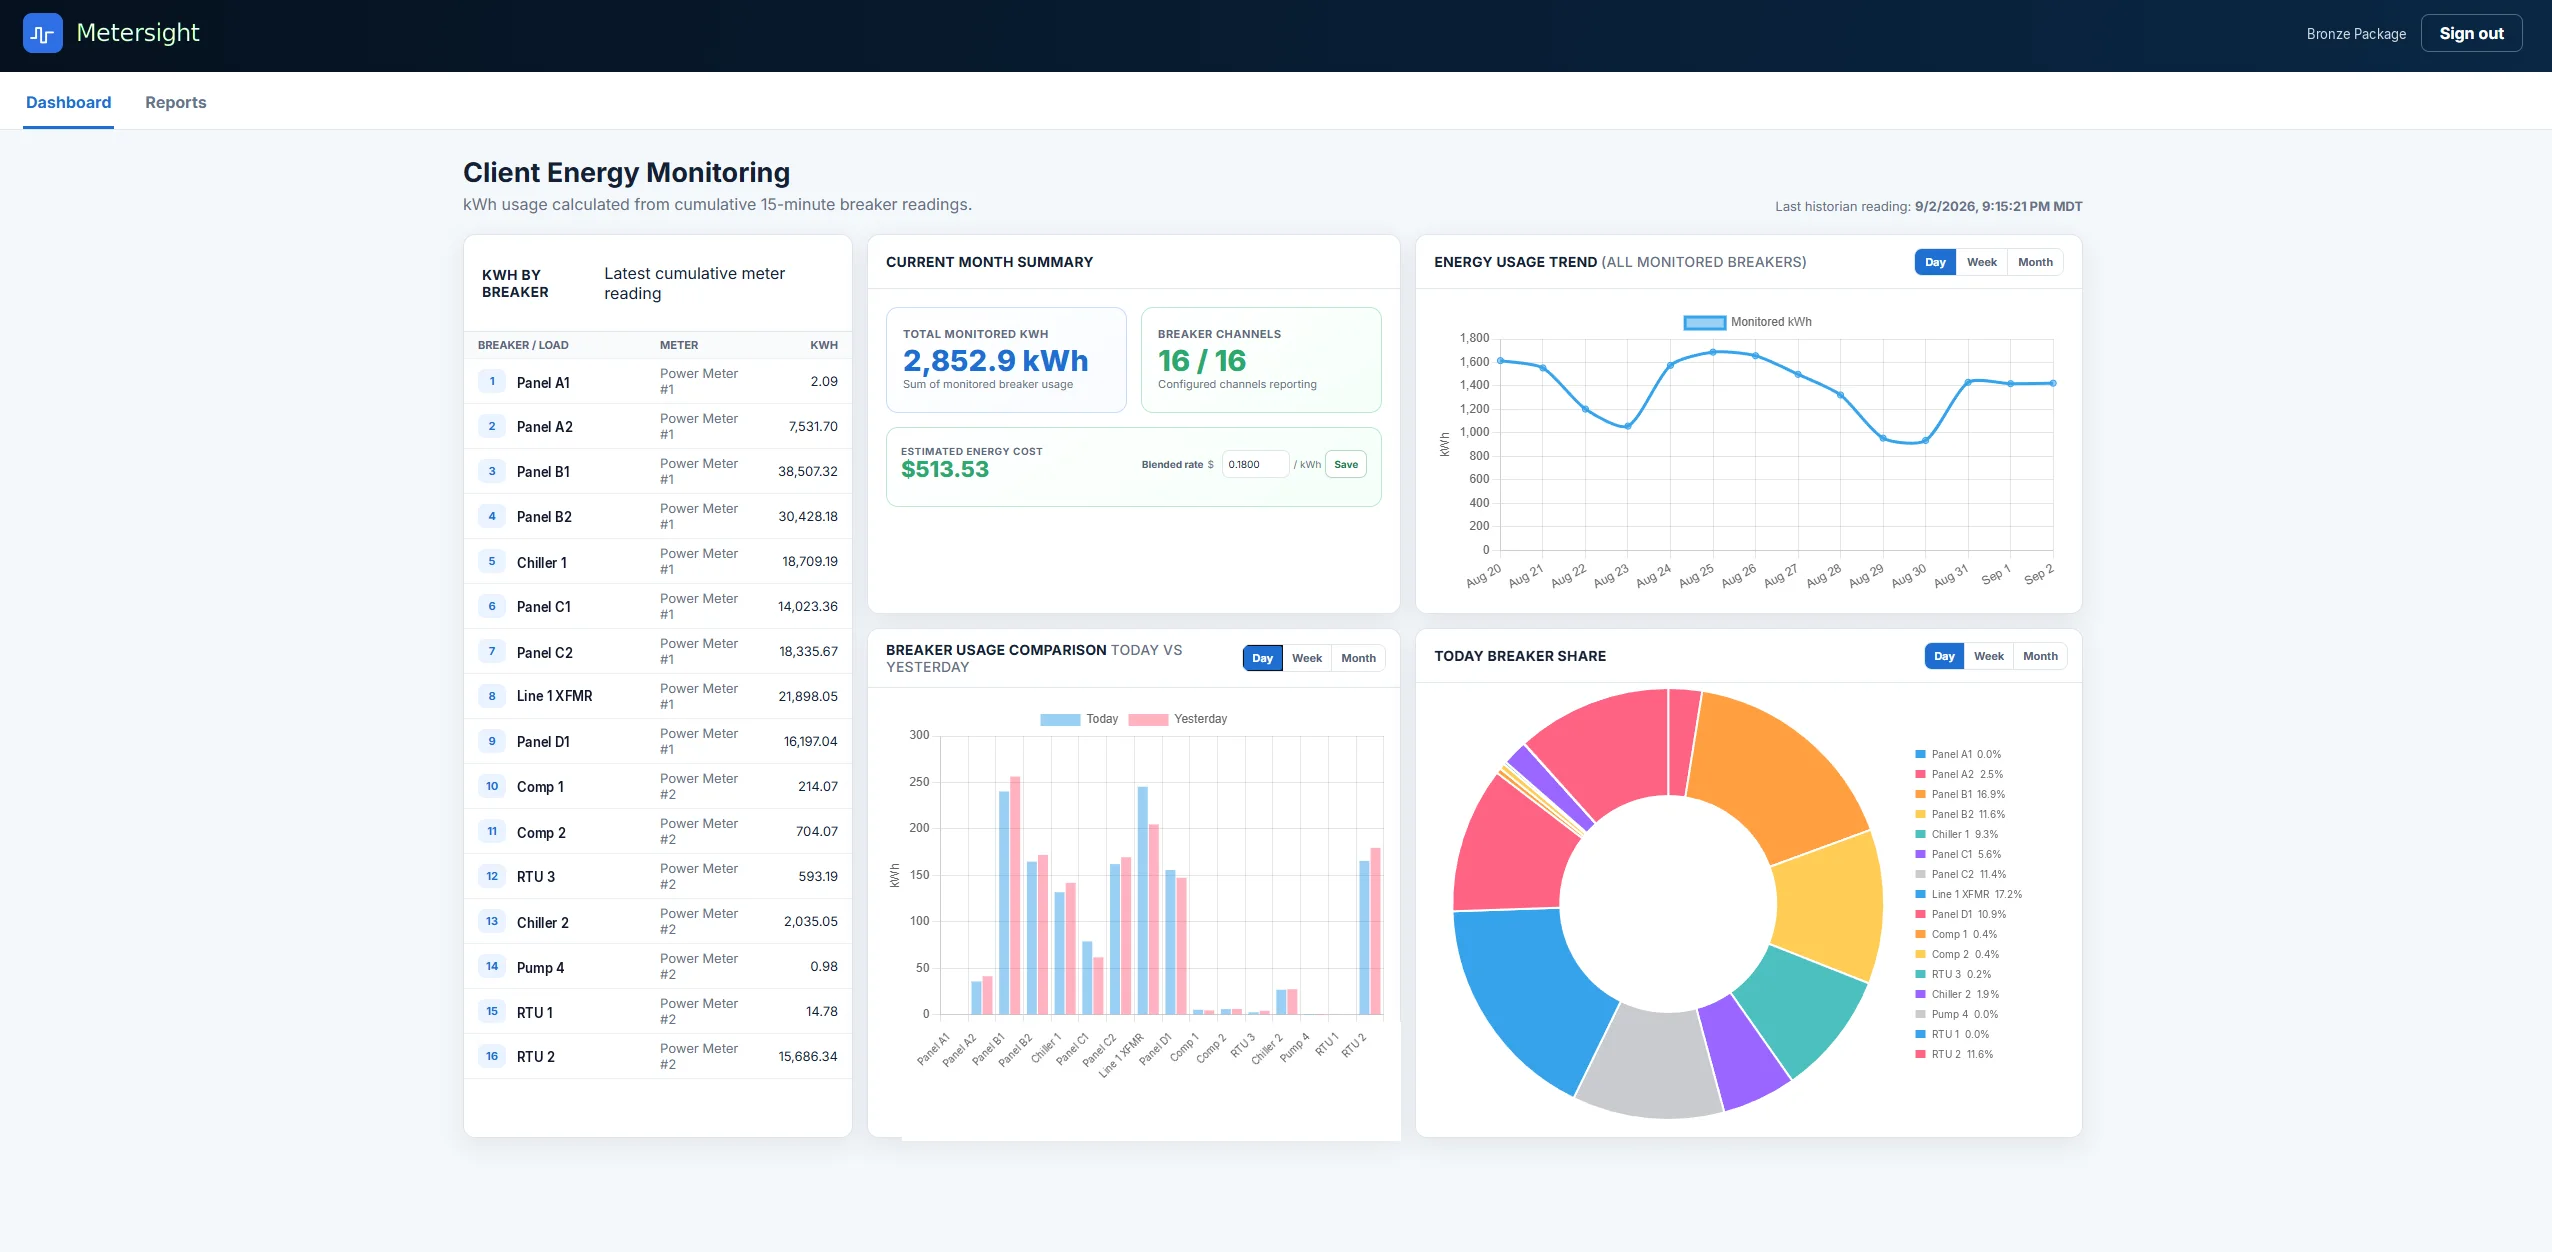
One is a total. The other is a rate.
This distinction causes more confusion than any other topic in facility electrical work, so it is worth being precise about it.
How much electricity has been used?
Measured over an interval. Appears as consumption charges on your bill. Useful for budgeting, benchmarking and allocation.
How much electricity is being used right now?
Measured at this moment. Drives demand charges, conductor sizing and protective device coordination.
On most commercial and industrial tariffs you pay twice: once for total energy consumed, and once for the single highest fifteen minute power peak in the billing period. The second charge is set by one brief moment. Power monitoring is how you find that moment.
Everything a modern meter can tell you.
We read the full register map rather than the two or three values a basic gateway exposes.
Real power (kW)
The power actually doing work. What demand charges are based on.
Apparent & reactive
kVA and kVAR, so you can see the gap between supplied and useful power.
Voltage
Line to line and line to neutral, per phase, with imbalance calculation.
Current
Per phase amps plus neutral current, which often reveals harmonic problems.
Frequency
Hertz, useful on generator and co generation systems.
Power factor
Displacement and true power factor, trended over time.
Demand
Rolling and fixed window demand calculated the way your utility calculates it.
Harmonics
THD on voltage and current where the meter supports it.
Find out while you can still do something.
A monthly report tells you what a problem cost. An alarm tells you a problem is starting.
- Approaching demand threshold, before the peak is set, not after.
- Power factor below target, catch a failed correction capacitor early.
- Phase loss or imbalance, the single most damaging condition for three phase motors.
- Voltage outside tolerance, sags and swells correlated against equipment faults.
- Meter communication lost, because a silent system looks identical to a healthy one.
A worked example
A plant sets a monthly demand peak of 1,046 kW at 06:12 on a Tuesday. The interval data shows three large motors starting within the same ninety seconds, at the shift change.
Nothing was broken. Nothing needed replacing. Staggering the start sequence by four minutes moved the peak down to 870 kW.
That change was invisible without interval data, and it is worth the same amount every month for as long as the sequence holds.
Answers before you call.
Real power in kilowatts, apparent power in kVA, reactive power in kVAR, line and phase voltage, current per phase, frequency, power factor and, on capable meters, harmonic distortion. All of it live, and all of it logged so you can go back and look at what happened at 2am.
Power factor is the ratio between the power doing useful work and the total power your facility draws. A poor power factor means you are moving more current than the work requires, which wastes capacity in your conductors and transformers, and many utilities apply a penalty for it. Monitoring shows you whether correction is worth the investment before you buy capacitors.
Often, yes. Voltage sags, phase imbalance and inrush current are all invisible on a monthly bill but obvious in interval data. When a drive faults intermittently, the electrical conditions in the seconds before the fault are usually the fastest route to a cause.
Both, along with split phase and multi circuit meters that measure many branch circuits from one device. The right choice depends on what you are trying to separate and how much panel space you have.
Dashboards typically refresh every one to five seconds. The underlying logging rate is configurable: sub second capture is possible for power quality investigation, while long term trending is usually stored at one minute or fifteen minute intervals to keep the historian a sensible size.
Yes. Alarms can be set on any measured value: high demand approaching a billing threshold, low power factor, phase loss, voltage outside tolerance or a meter that has stopped responding. They can be delivered on screen, by email or by text.
Put your switchgear on a screen.
Bring your meter list. We will tell you what can be read today and what would need to change.
Or call (801) 946-2710, Monday, Friday, 8:00am, 4:30pm MT
Related MeterSight topics