
Know exactly where your electricity goes.
Energy monitoring answers one question with real numbers: how much electricity did this facility use, and which parts of it are responsible? We build the metering, the historian and the reports that turn a utility invoice into something you can act on.
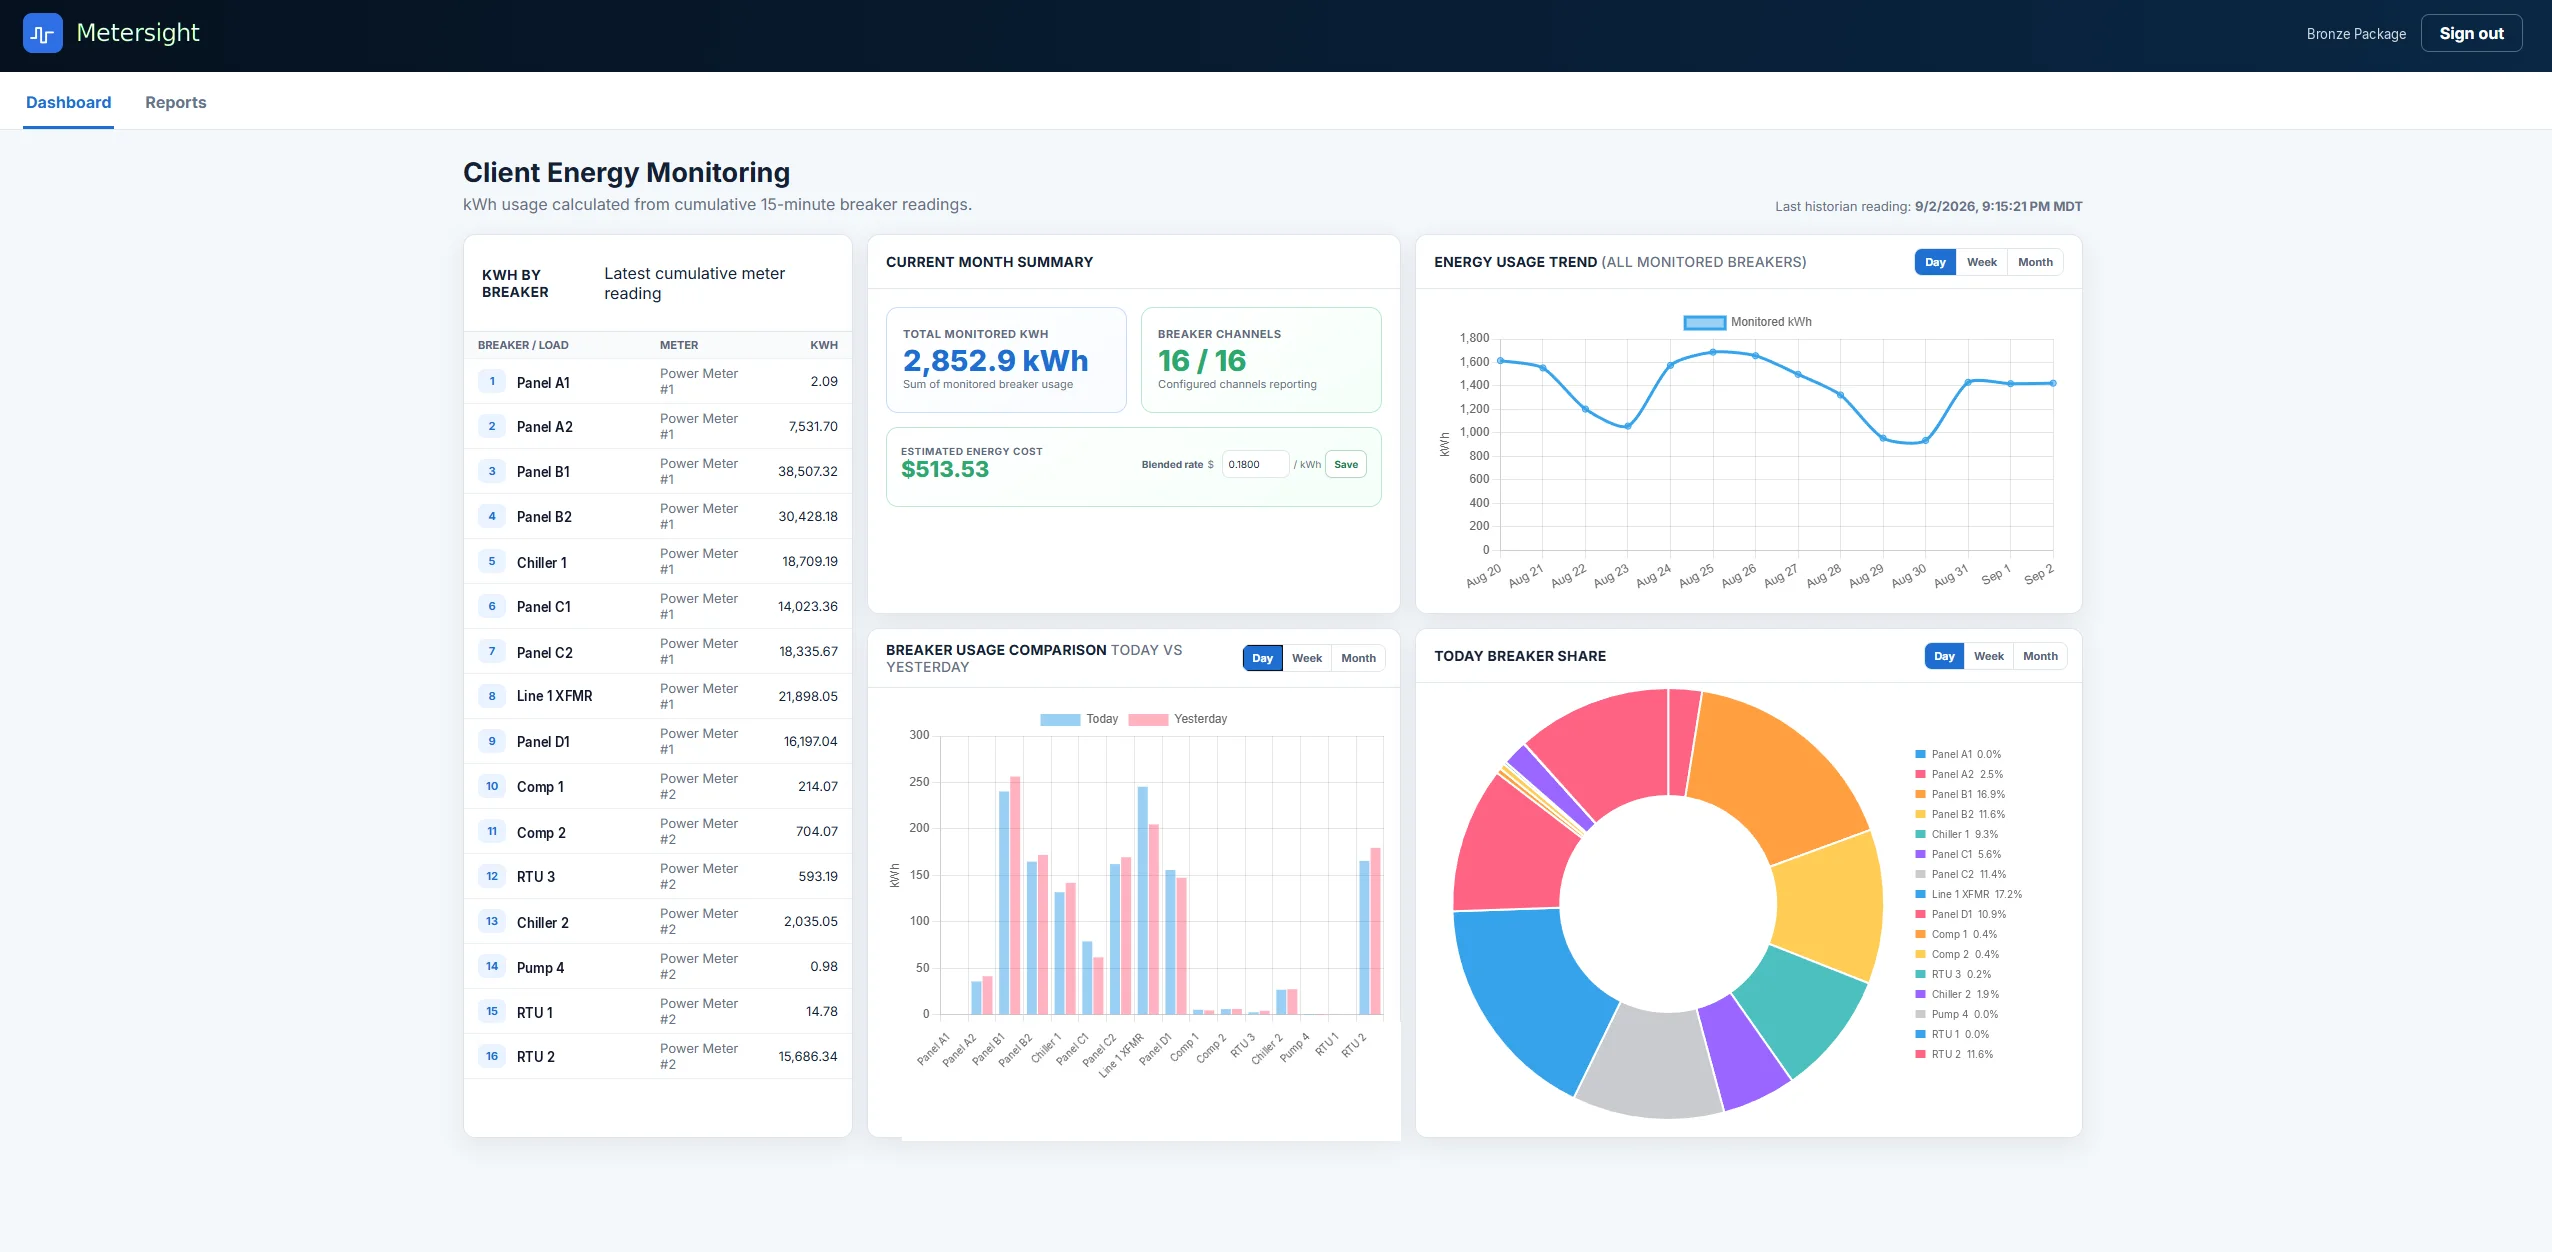
Consumption, cost and cause, in one place.
A utility bill tells you what happened to the whole building. Energy monitoring tells you which part of the building did it.
Historical trends
Compare this month against last month, this year against last year, or a Tuesday against every other Tuesday. Trends are where waste becomes obvious.
Energy by area
Break consumption down by department, production line, tenant, building or individual load. You cannot manage what you cannot separate.
Cost visibility
Apply your actual rate structure, including time of use periods, so the dashboard shows dollars, not just kilowatt hours.
Dashboards
Web based screens that work on a phone, a laptop or a wall mounted display in the maintenance office. No client software to install.
PDF reports
Monthly summaries, tenant statements and management reports generated from the same historian the dashboards read from.
CSV export
Raw interval data out of the system whenever you want it. Your data stays yours, in a format any analyst can use.
The four things customers find first.
- Equipment left running. Compressors, exhaust fans and process heaters that never shut down over a weekend show up immediately on an overnight baseline.
- Demand spikes you are paying for. A single badly timed start sequence can set a demand charge that follows you for eleven more months.
- Drift. Equipment rarely fails all at once. It gets less efficient first, and a trend line catches that months before a breakdown does.
- Allocation disputes. When each tenant or department has its own meter data, the conversation stops being an argument.
Most facilities recover the cost of a monitoring system from the first or second finding, not from a long term efficiency programme. The value is in seeing what was already happening.
Four stages, in this order.
Meter inventory
We find out what you already have. Many facilities have capable meters installed that have never been connected to anything.
Data collection
We poll the meters over Modbus TCP, Modbus RTU, BACnet or pulse inputs and write the values into a historian with proper timestamps.
Dashboards and reports
Screens built around the questions you actually ask, plus the scheduled PDF and CSV output that goes to people who never open a dashboard.
Handover
Documentation, tag lists, backups and training. You own the system, the data and the ability to change it.
Built for three kinds of buildings.
Commercial buildings
Multi tenant offices, retail centres and mixed use properties. Submetering for tenant billing, common area allocation and portfolio comparison across a group of properties.
Manufacturing
Energy per unit produced, consumption by line and shift over shift comparison. The number that matters is rarely total kWh, it is kWh per thing you made.
Utilities & campuses
Feeder level data collection, substation monitoring and reporting across distributed sites that need to roll up into one view.
Answers before you call.
Energy monitoring measures kilowatt hours: how much electricity has been consumed over a period of time. Power monitoring measures kilowatts: how much is being drawn at this instant. Energy is what your utility bills you for in consumption charges. Power is what drives demand charges and equipment sizing. Most facilities need both, on the same screen.
Usually not. If your meters already speak Modbus TCP, Modbus RTU, BACnet or have a pulse output, we can almost always read them. We start by inventorying what you have. Adding meters is a decision about the granularity you want, not a prerequisite for getting started.
Fifteen minute intervals match most utility billing structures and are the common default. One minute or faster logging is possible where it is useful, such as isolating a demand spike caused by a single motor start. Faster logging means more storage, so we size the historian for the interval you choose.
Yes, and this is usually where the value shows up. Total kWh only tells you the plant used more electricity. Energy per unit produced tells you whether that was efficient. If your production counts are available from a PLC, MES or a spreadsheet, we can normalise consumption against them.
Either. Some facilities want everything inside their own network with no external connectivity. Others want a hosted system their regional managers can reach from anywhere. We build both, and the choice is generally driven by your IT policy rather than by technical limits.
Yes. Sites can report into a single historian so you can compare buildings, plants or regions against each other, with per site drill down and a roll up view for whoever owns the overall budget.
See it running on real data.
We will walk through a live system, then talk about what your meters could tell you.
Or call (801) 946-2710, Monday, Friday, 8:00am, 4:30pm MT
Related MeterSight topics