
Total kWh is the wrong number.
A plant that used more electricity last month may simply have made more product. The number that tells you something is energy per unit produced, and almost nobody measures it.
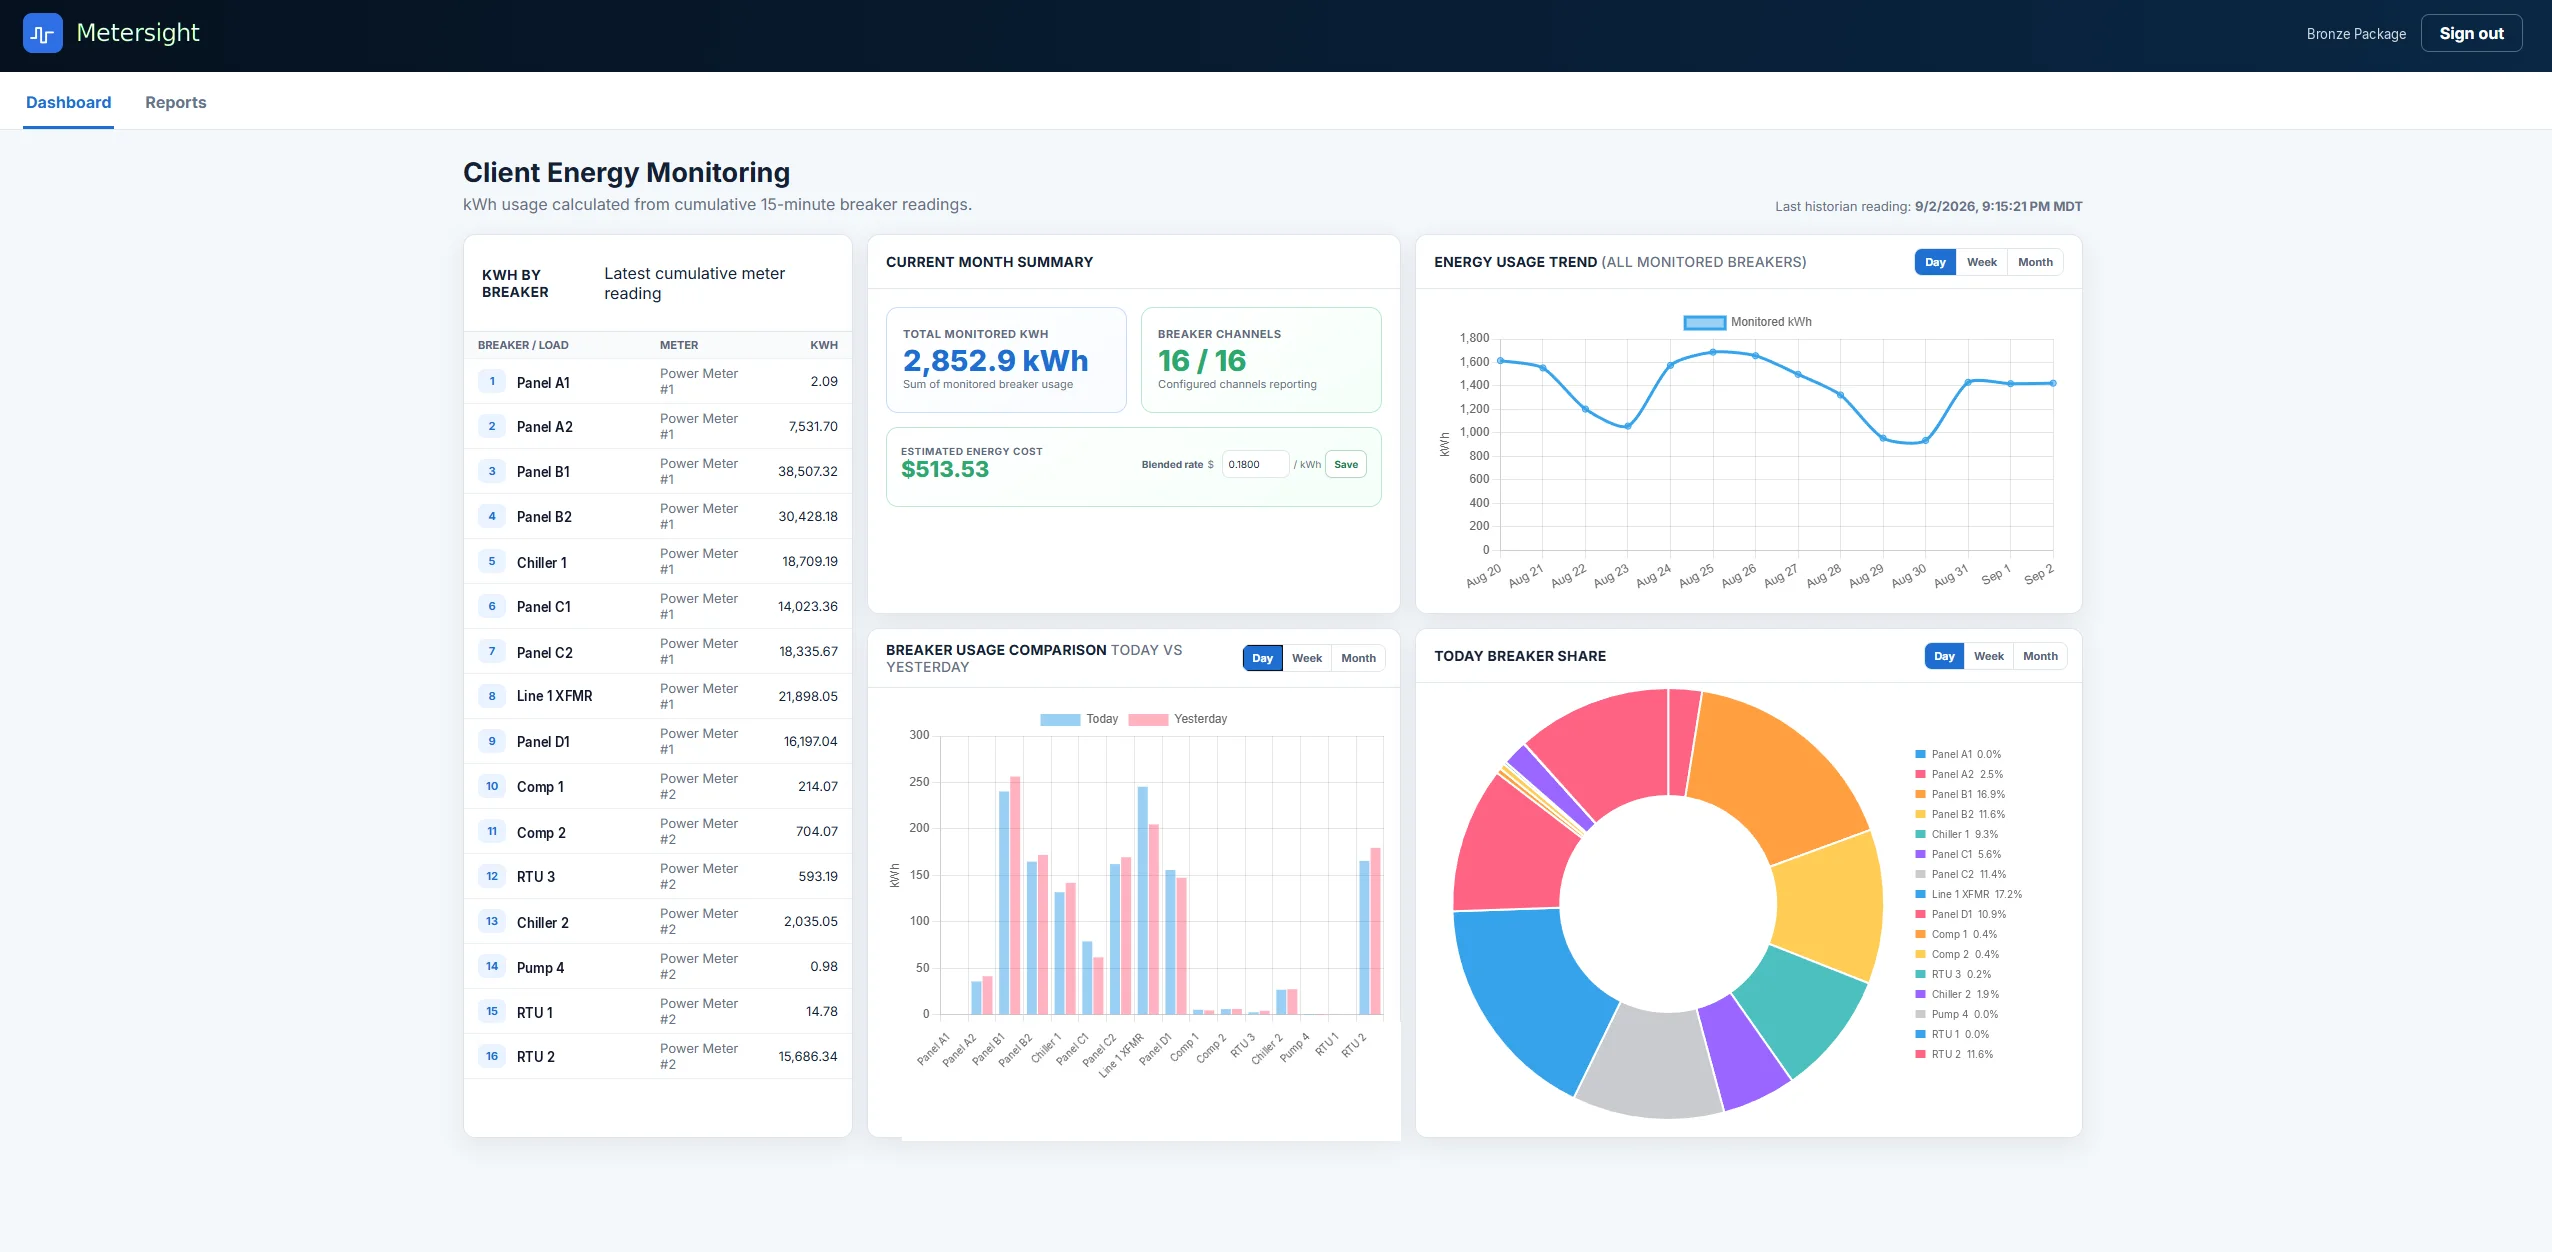
Normalise against output, or you are measuring the weather.
Most industrial energy programmes stall for the same reason: total consumption moves for reasons that have nothing to do with efficiency. Production volume changes. Product mix changes. Summer happens. Against that noise, a genuine five percent improvement is invisible.
Normalising fixes it. Divide consumption by units produced, pounds shipped, cases filled or whatever your plant counts, and you get a figure that is comparable month to month and line to line. Suddenly a drifting compressor shows up as a trend rather than disappearing into a busy quarter.
Getting production counts into the same system as energy data is usually the harder half of the job. They may live in a PLC, an MES, an ERP or a spreadsheet somebody maintains by hand. All of those can be read.
If you do nothing else, meter the main incomer and look at what the plant draws when it is not producing. That single number has paid for more monitoring systems than any efficiency programme.
What we measure in a plant.
The breakdown that makes industrial consumption actionable.
Energy per unit produced
Consumption divided by output, trended over time and compared across lines making the same product.
Consumption by line
Which production line, cell or process area is responsible for what share of the bill.
Shift comparison
The same equipment, the same product, three different crews. The differences are frequently large and always instructive.
Idle and non production load
What the plant draws at 3am on a Sunday. This baseline is the single most reliable source of easy savings.
Compressed air
Usually the most expensive utility per unit of useful work in a plant, and usually the least monitored.
Process heating and cooling
Ovens, chillers and dryers, where setpoint drift shows up in consumption long before it shows up in product quality.
Where industrial plants find savings.
In rough order of how often we see them.
- Weekend and overnight baseline. Equipment nobody remembers is running. This is the first thing we look at and it is almost never zero.
- Compressed air leaks. A leak is a load that runs continuously and produces nothing. Overnight air consumption puts a number on it.
- Sequential motor starts. Three large drives starting inside ninety seconds can set a demand peak that costs more than the energy they use all month.
- Chiller and cooling tower staging. Equipment cycling against itself because control setpoints were never revisited after an expansion.
- Drifting equipment. Motors, heaters and pumps rarely fail suddenly. They get less efficient first, and only a trend catches that.
- Product mix effects. Some products cost far more per unit to make than the standard costing suggests. Metered data settles the argument.
- Shift variance. Same line, same product, materially different consumption. Usually a procedural difference that can be standardised.
- Unmetered loads. When submeter totals never reconcile with the utility bill, the gap is telling you something.
Answers before you call.
Usually from the PLC that already counts them, since most lines have a part counter or a flow totaliser. Where that is not available we can read from an MES or ERP database, or accept a manual entry per shift. Any of these is better than not normalising at all.
No, and starting that way is usually a mistake. Begin with the main incomer and the four or five largest loads. That typically accounts for most of the consumption, and it tells you where finer metering would actually pay for itself.
The overnight baseline is visible within a week of the first meter reporting. Meaningful normalised trends need a few production cycles, usually a month or two, before comparison means much.
It provides the measurement layer those frameworks require: energy baselines, performance indicators and evidence of change over time. We build the data side; the management system itself is your responsibility.
Yes, and in most plants it should. Comparing electricity, gas and air on one timeline is often where a pattern becomes obvious that none of them showed alone.
What does a unit of your product cost to make?
In kilowatt hours, not dollars. Most plants cannot answer that, and the answer is usually surprising.
Or call (801) 946-2710, Monday, Friday, 8:00am, 4:30pm MT