
Your biggest motors decide your electricity bill.
In a manufacturing plant, power is dominated by rotating equipment. Extruders, compressors, chillers and pumps set the demand peak, drive the power factor and cause most of the electrical faults.
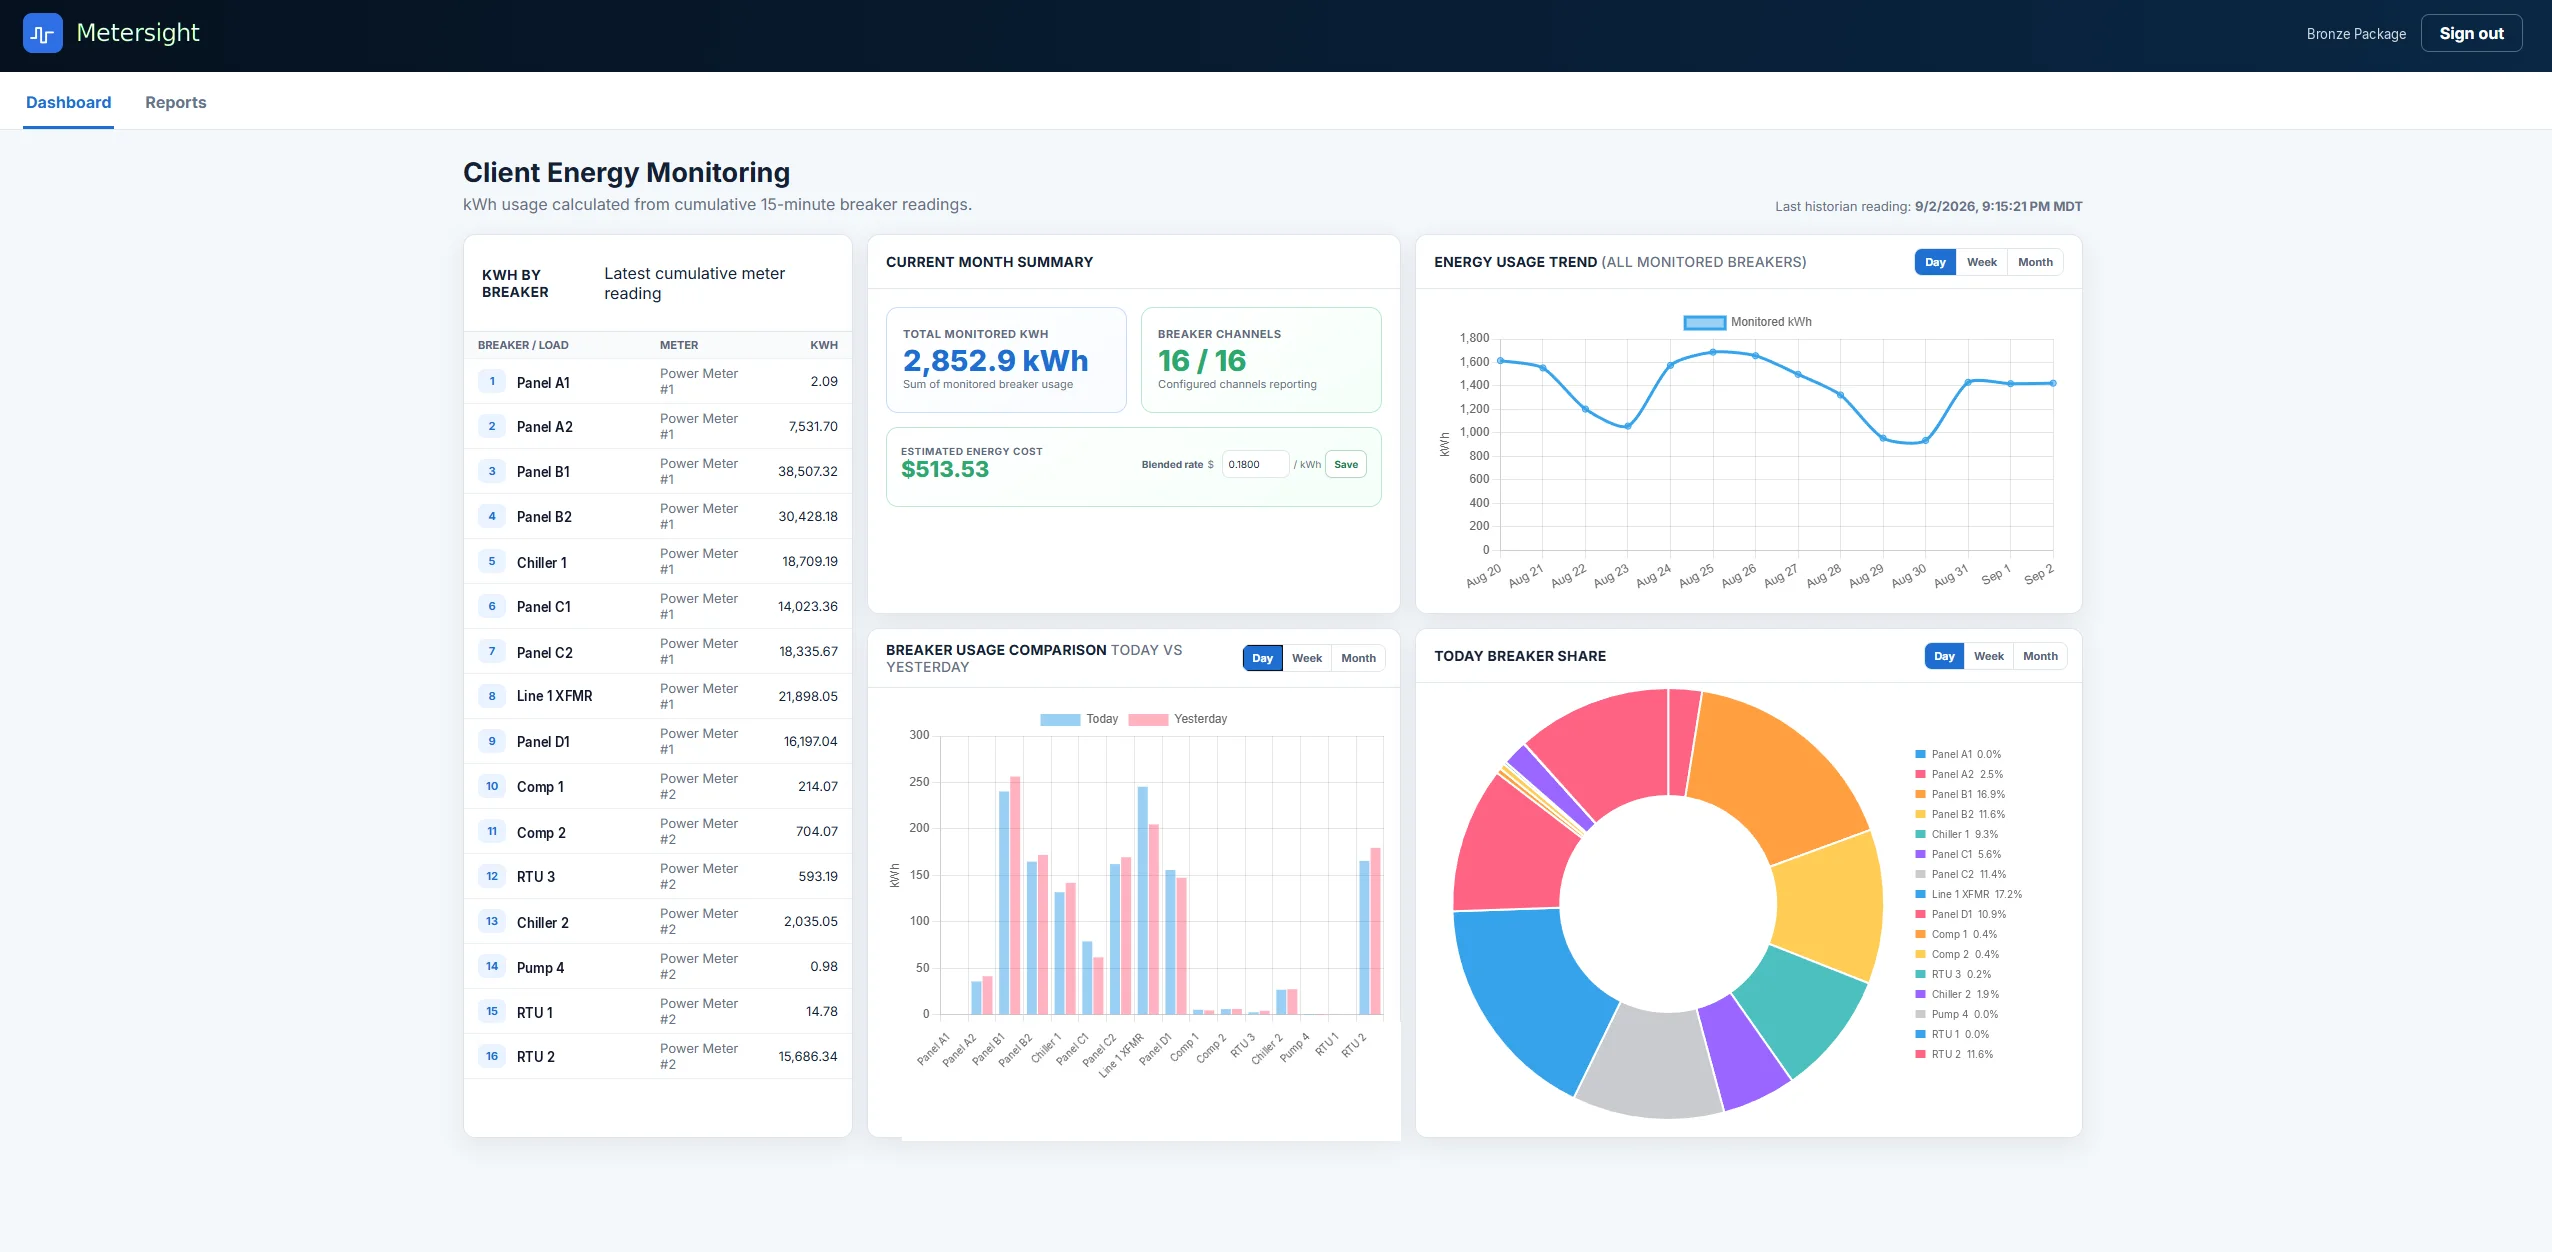
Process load, not building load.
Industrial power monitoring differs from building monitoring in what dominates the picture. A commercial building's load is relatively smooth and driven by occupancy and weather. A plant's load is spiky, driven by process events, and shaped almost entirely by motors starting and stopping.
That changes what is worth measuring. Demand peaks matter more, because a single start sequence can set a charge that persists for a year. Power factor matters more, because induction motors running below rated load are the primary cause of a poor one. Phase imbalance matters more, because it destroys the motors themselves.
It also changes where meters go. Feeder level metering on the MCC lineups usually tells you more, for less money, than metering individual machines, and it maps onto how plant electrical systems are actually built.
What we monitor in a plant electrical system.
Working outward from the switchgear to the equipment.
Feeder loading
Live kW per feeder and per MCC, so you can see which part of the plant is responsible for a rise as it happens.
Motor load profiling
How hard a motor is actually working against its rating. Chronically oversized motors are a common and expensive finding.
Demand peak analysis
What set the billing peak, when, and which loads coincided. This is where the fastest financial return usually sits.
Power factor
Trended per feeder rather than as a single site figure, so correction can be targeted where it will actually help.
Phase imbalance
Voltage and current imbalance, which shortens motor life quietly and is invisible without measurement.
Starting current
Inrush captured at sufficient resolution to explain nuisance trips and voltage sags elsewhere in the plant.
Faults that power data explains.
Problems that look mechanical, electrical or random until you have interval data.
- Drives tripping on undervoltage when a large motor starts elsewhere in the plant.
- Motors running hot with no obvious mechanical cause, traced to voltage imbalance across phases.
- Nuisance breaker trips caused by inrush coinciding rather than by any single load being oversized.
- Transformer running warmer than expected because harmonic current from a bank of drives was never accounted for.
- Power factor penalty appearing suddenly when a correction capacitor bank fails silently.
- Demand charges rising without more production, caused by a changed start sequence after a shift pattern change.
- Intermittent control faults correlated with a specific process step, visible only when electrical and process data share a timeline.
- Neutral current higher than any phase, a classic signature of triplen harmonics from non linear loads.
Answers before you call.
Power monitoring measures the instantaneous rate in kilowatts and the electrical conditions alongside it. Energy monitoring measures accumulated kilowatt hours over time. Plants generally need both, and they usually share the same meters and the same system.
Main incomer first, then the MCC lineups or major feeders. Individual machine metering comes later and only where the feeder data suggests it would tell you something new.
Often, yes. Many VFDs already report motor current, power and load percentage over the network. If your drives are already on EtherNet/IP or Modbus, that data is available without adding hardware.
Sub cycle capture is needed to characterise inrush properly, which most revenue meters cannot do. For most plants, high resolution logging on a capable meter at the affected feeder is sufficient to establish cause and correlation.
Yes, and that is one of the better reasons to measure before buying. Trended power factor per feeder, combined with your utility's penalty structure, turns a sales proposal into an arithmetic problem.
Which motor set your last demand peak?
If you cannot answer that, the interval data almost certainly can.
Or call (801) 946-2710, Monday, Friday, 8:00am, 4:30pm MT